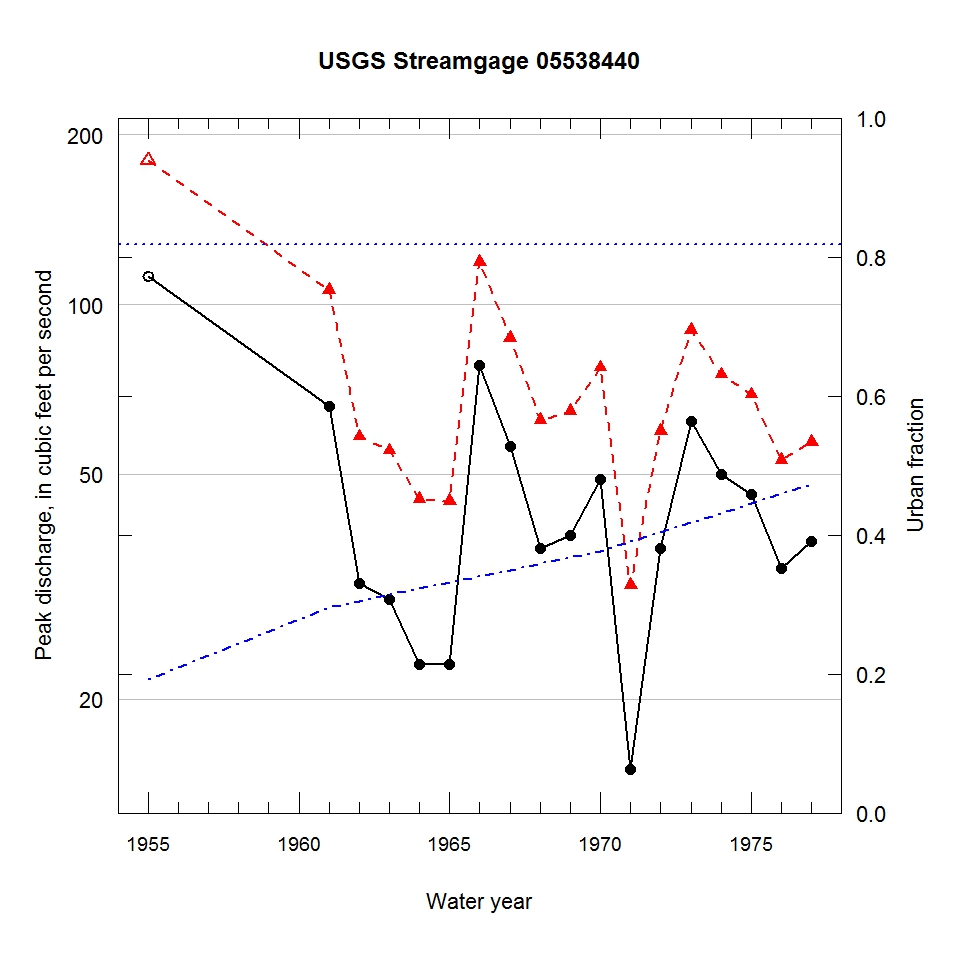
Observed and urbanization-adjusted annual maximum peak discharge and associated urban fraction and precipitation values at USGS streamgage:
05538440 SPRING CREEK NEAR ORLAND PARK, IL


| Water year | Segment | Discharge code | Cumulative reservoir storage (acre-feet) | Urban fraction | Precipitation (inches) | Observed peak discharge (ft3/s) | Adjusted peak discharge (ft3/s) | Exceedance probability |
| 1955 | 1 | 7 | 0 | 0.192 | 3.214 | 112 | 180 | 0.018 |
| 1961 | 1 | -- | 0 | 0.296 | 1.419 | 66 | 106 | 0.125 |
| 1962 | 1 | 2 | 0 | 0.305 | 0.268 | 32 | 58 | 0.610 |
| 1963 | 1 | 2 | 0 | 0.314 | 1.497 | 30 | 55 | 0.659 |
| 1964 | 1 | -- | 0 | 0.323 | 0.926 | 23 | 45 | 0.807 |
| 1965 | 1 | -- | 0 | 0.332 | 0.871 | 23 | 45 | 0.812 |
| 1966 | 1 | -- | 0 | 0.341 | 1.399 | 78 | 119 | 0.080 |
| 1967 | 1 | -- | 0 | 0.350 | 1.141 | 56 | 87 | 0.225 |
| 1968 | 1 | 2 | 0 | 0.359 | 1.468 | 37 | 62 | 0.545 |
| 1969 | 1 | -- | 0 | 0.368 | 0.145 | 39 | 65 | 0.511 |
| 1970 | 1 | -- | 0 | 0.377 | 1.085 | 49 | 77 | 0.338 |
| 1971 | 1 | 2 | 0 | 0.390 | 0.931 | 15 | 32 | 0.944 |
| 1972 | 1 | -- | 0 | 0.404 | 1.232 | 37 | 60 | 0.588 |
| 1973 | 1 | -- | 0 | 0.418 | 0.839 | 62 | 90 | 0.202 |
| 1974 | 1 | -- | 0 | 0.432 | 1.210 | 50 | 75 | 0.367 |
| 1975 | 1 | -- | 0 | 0.446 | 1.006 | 46 | 69 | 0.448 |
| 1976 | 1 | -- | 0 | 0.459 | 0.904 | 34 | 53 | 0.697 |
| 1977 | 1 | -- | 0 | 0.473 | 1.431 | 38 | 57 | 0.628 |

